Data analysis is one of the most crucial stages of any dissertation. It transforms raw data into meaningful insights that support or challenge your research hypothesis. Whether you’re working with qualitative interviews or quantitative survey data, the goal remains the same: to interpret your findings in a way that contributes to your academic field. Practical data analysis involves selecting the proper methods, preparing your data, using appropriate tools, and interpreting results clearly and accurately. You can confidently analyse your research data and draw well-supported conclusions with a solid understanding of these steps.
What is data analysis?
Data analysis is collecting, cleaning, organising, and interpreting data to uncover valuable information, draw conclusions, and support decision-making. It involves examining data through statistical and logical methods to identify patterns, trends, or relationships. The main types of data analysis include descriptive (what happened), diagnostic (why it happened), predictive (what might happen), and prescriptive (what should be done). Used across various fields, data analysis helps organisations and individuals make informed decisions based on evidence rather than assumptions.
Types of Data Analysis in a Dissertation
The type of data analysis used in a dissertation depends mainly on the nature of the research: quantitative, qualitative, or mixed methods. Each approach involves different techniques and serves different research goals. Below are the main types:
-
Quantitative Data Analysis
This involves numerical data and uses statistical techniques to identify patterns, test hypotheses, and make predictions. Common methods include:
-
Descriptive statistics (mean, median, mode)
-
Inferential statistics (t-tests, ANOVA, regression analysis)
-
Correlation analysis
-
Factor analysis
-
Qualitative Data Analysis
This approach deals with non-numerical data such as interviews, open-ended survey responses, or observational notes. It focuses on understanding meanings, themes, and patterns. Common techniques include:
-
Thematic analysis
-
Content analysis
-
Narrative analysis
-
Discourse analysis
-
Grounded theory
-
Mixed Methods Analysis
A combination of both quantitative and qualitative analysis is used when a study involves both numerical data and text-based insights. This approach provides a more comprehensive understanding of research questions by integrating statistical findings with in-depth qualitative interpretations.
-
Comparative Analysis
Often used in case studies, this type compares two or more variables, groups, or cases to identify similarities and differences. It can be applied in both quantitative and qualitative frameworks.
-
Longitudinal Analysis
Analyse data collected over time to identify trends, patterns, or changes. This method is standard in studies exploring developments or behaviours over months or years.
Difference between analysis and discussion in a dissertation
-
Definition:
-
Analysis: The section systematically examines the data collected through quantitative or qualitative methods. It involves interpreting raw data, identifying patterns, trends, and relationships, and applying statistical or thematic techniques to draw meaningful insights.
-
Discussion: The discussion section interprets the findings about the research questions, existing literature, and theoretical frameworks. It explains the implications of the results, their significance, and how they align or differ from previous studies.
-
Objective:
-
Analysis: To objectively present data without inserting personal opinions or subjective interpretations.
-
Discussion: To interpret and contextualise the data, explain unexpected findings, discuss implications, and propose recommendations.
-
Content:
-
Analysis: Data visualisation (graphs, tables, charts), statistical tests, coding schemes, and thematic analysis.
-
Discussion: Interpretations of findings, implications, limitations, connections to literature, and suggestions for future research.
-
Writing Style:
-
Analysis: Technical, objective, and data-focused.
-
Discussion: Analytical, interpretative, and reflective.
-
Placement:
|
Analysis |
Discussion |
| Definition |
Using statistical or thematic techniques, examines raw data to identify patterns, trends, and relationships. |
Interprets the findings about research questions, literature, and theoretical frameworks. |
| Objective |
To objectively present data without subjective interpretation. |
To provide meaning, context, and implications of the findings. |
| Content |
Data visualisation (charts, graphs), statistical tests, coding schemes. |
Interpretation of findings, implications, limitations, and recommendations. |
| Writing Style |
Technical, objective, data-centric. |
Analytical, reflective, interpretative. |
| Placement |
Follows the methodology section. |
Follows the analysis section. |
| Focus |
Focuses on “What was found?” |
Focuses on “What do the findings mean?” |
| Approach |
Quantitative (statistical tests) or qualitative (coding/themes). |
Comparative analysis with previous studies and literature. |
5 V’s of dissertation data analysis
The 5 V’s provide a framework to manage and analyse data in a dissertation effectively. They are:
-
Volume:
-
Refers to the sheer amount of data collected for the dissertation. This can include quantitative datasets, interview transcripts, survey responses, etc.
-
Example: A large dataset with thousands of survey responses requires advanced analytical tools (e.g., Python, SPSS) to manage and analyse effectively.
-
Velocity:
-
The speed at which data is generated, collected, and analysed. This is particularly relevant for real-time data analysis or longitudinal studies.
-
Example: Analysing social media sentiment data that is continuously updated over time.
-
Variety:
-
The data types collected include numerical data, text, images, and audio. It also refers to structured, semi-structured, and unstructured data.
-
Example: A mixed-methods dissertation might include quantitative survey data (structured) and interview transcripts (unstructured).
-
Veracity:
-
The reliability and accuracy of data. It addresses data quality, validity, and potential data collection and analysis biases.
-
Example: Ensuring data accuracy by cross-checking with multiple sources or using data validation techniques.
-
Value:
-
The usefulness of the data lies in answering research questions and achieving research objectives. The ultimate purpose of data analysis is to extract meaningful insights.
-
Example: Identifying significant patterns in data that provide actionable insights related to the research hypothesis.
Difference between Data Analysis and Data Processing
|
Data Processing |
Data Analysis |
| Definition |
The systematic collection, cleaning, organising, and transforming of raw data into a usable format. |
Examining and interpreting processed data to derive insights, patterns, and conclusions. |
| Objective |
To convert raw data into a structured and organised format. |
To extract meaningful insights and draw conclusions based on the processed data. |
| Methods |
Data cleaning, data formatting, data integration, and data transformation. |
Statistical analysis, thematic analysis, data visualisation, predictive modelling. |
| Tools |
Excel, Python, SQL, ETL Tools (e.g., Talend, Informatica). |
R, Python, SPSS, Tableau, Power BI. |
| Output |
Organised datasets ready for analysis (e.g., spreadsheets, databases). |
Reports, graphs, statistical summaries, and interpretations. |
| Focus |
Focuses on data preparation and data quality. |
Focuses on interpreting data to support decision-making. |
| Sequence |
Precedes data analysis; acts as a prerequisite step. |
Follows data processing; uses the processed data for analysis. |
| Example |
Cleaning and formatting survey responses for consistency. |
Analysing survey responses to identify customer satisfaction trends. |
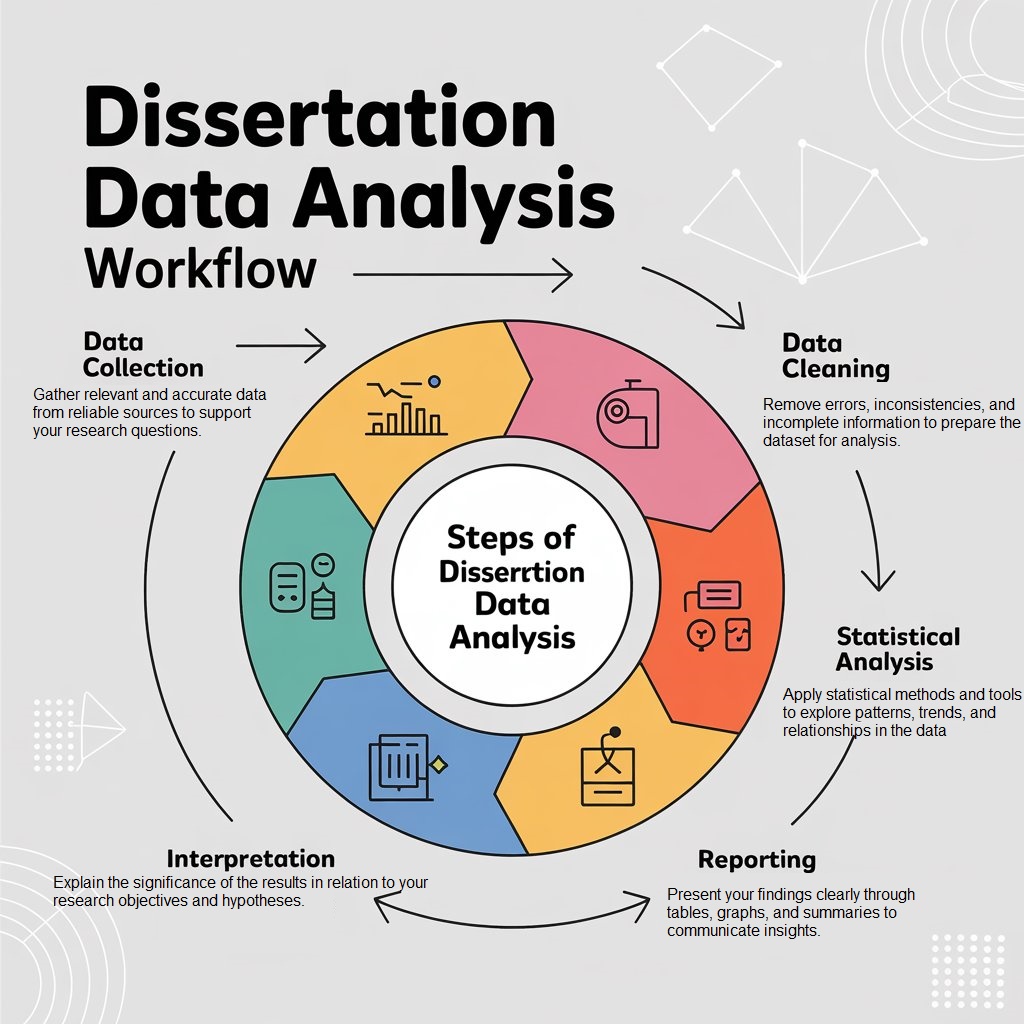
Steps of Dissertation Data Analysis?
Data analysis is a critical stage in the dissertation process that transforms raw data into valuable insights. A systematic approach ensures accuracy, credibility, and alignment with your research objectives. Below are the detailed steps involved in conducting practical data analysis
1. Define Clear Research Questions and Objectives
Before any analysis begins, establish specific and focused research questions. These guide the entire analysis process and determine the data types you collect, the tools you use, and the conclusions you draw. Consider:
-
What are you trying to discover, test, or explain?
-
Are your questions exploratory (qualitative), explanatory (quantitative), or both (mixed methods)?
-
What are your hypotheses or assumptions?
A well-defined research question ensures that your data analysis remains purposeful and structured.
2. Prepare and Organise Your Data
Data preparation is essential for ensuring reliability and ease of analysis. This stage includes:
-
Data cleaning: Remove duplicates, handle missing values, and correct data entry errors.
-
Data formatting: Structure your data into spreadsheets, software databases, or transcripts.
-
Coding: Assign labels or tags to themes or responses for qualitative data.
-
Anonymization: Remove personal identifiers to maintain ethical standards and comply with data protection regulations.
Proper organisation enables efficient use of analytical tools and minimises bias or errors during interpretation.
3. Select the Appropriate Method of Analysis
Choose analysis methods that align with your research design and data type:
-
Quantitative methods may include descriptive statistics (mean, standard deviation), inferential statistics (regression, correlation, ANOVA), and hypothesis testing.
-
Qualitative methods involve identifying patterns, themes, and narratives through thematic analysis, grounded theory, or discourse analysis.
-
Mixed methods research integrates both approaches, offering broader insights.
Your choice should also consider the research paradigm (positivist, interpretivist, etc.) and the nature of your data (nominal, ordinal, interval, ratio).
4. Use Suitable Software and Tools
Leverage software to streamline your analysis and enhance accuracy:
-
For quantitative data: SPSS, STATA, R, Python, or Microsoft Excel.
-
For qualitative data: NVivo, ATLAS.ti, MAXQDA, or manual coding using spreadsheets.
-
For mixed methods: Use a combination of tools or integrated platforms like Dedoose.
Familiarity with your selected tools will improve the efficiency and reliability of your analysis.
5. Conduct the Analysis
Now, apply your chosen methods to analyse the data:
-
In quantitative analysis, input data into statistical software, run relevant tests, and interpret output such as p-values, confidence intervals, and effect sizes.
-
In qualitative analysis, read and re-read the data, apply codes, group them into categories, and generate themes that answer your research questions.
-
In mixed methods, quantitative and qualitative data are analysed separately, and the results are integrated to provide a holistic interpretation.
Maintain detailed notes throughout this process to document your rationale and thought process.
6. Interpret the Results
Analysis alone is not enough; you must interpret what the data means. This step involves:
-
Connecting findings back to your research questions and objectives.
-
Comparing results with previous studies or theoretical frameworks.
-
Explaining unexpected findings or inconsistencies.
Avoid overstating your results. Be honest about what your data can and cannot reveal, and consider alternative interpretations where appropriate.
7. Validate and Ensure Trustworthiness
To enhance the credibility of your findings:
-
Assess reliability (consistency) and validity (accuracy) for quantitative studies. You might run additional checks, like Cronbach’s alpha for reliability.
-
For qualitative studies, focus on trustworthiness through triangulation, member checking, and audit trails.
-
In mixed methods, ensure both datasets are analysed rigorously and integrated meaningfully.
This step boosts the academic integrity of your dissertation.
8. Present Your Findings Clearly
Effective presentation of data is essential for reader comprehension:
-
Use tables, graphs, and charts to display quantitative results.
-
For qualitative findings, include direct quotes, theme maps, or coding trees.
-
Ensure visuals are clearly labelled, referenced in the text, and relevant to your analysis.
-
Organise findings into sections or subsections that reflect your research questions or themes.
Clarity and consistency help readers understand and engage with your work.
9. Draw Conclusions and Make Recommendations
Based on your analysis, summarise the key findings:
-
What do the results imply for theory, practice, or policy?
-
Do they support or contradict your hypotheses?
-
What are the limitations of your analysis?
-
What areas require further research?
Read on How to Write Good Survey Questions: 17 Best Practices
FAQ
1. What is data analysis in a dissertation?
Data analysis in a dissertation involves transforming raw data into meaningful insights that support or challenge the research hypothesis. It includes selecting appropriate methods, preparing data, applying analytical techniques, and interpreting results.
2. What are the main types of data analysis used in dissertations?
- Quantitative Data Analysis: Uses statistical techniques to analyse numerical data (e.g., t-tests, ANOVA, regression).
- Qualitative Data Analysis: Focuses on non-numerical data (e.g., thematic analysis, discourse analysis).
- Mixed Methods Analysis: Combines quantitative and qualitative approaches.
- Comparative Analysis: Compares variables, groups, or cases.
- Longitudinal Analysis: Examines data collected over time to identify trends.
3. How is analysis different from discussion in a dissertation?
- Analysis: Focuses on objectively presenting and examining data using statistical or thematic techniques.
- Discussion: Interprets findings, explains implications, and connects results to existing literature and theoretical frameworks.
-
What are the 5 V’s of dissertation data analysis?
- Volume: The amount of data collected.
- Velocity: The speed of data generation and analysis.
- Variety: The types of data (numerical, text, images).
- Veracity: The accuracy and reliability of data.
- Value: The usefulness of data in addressing research objectives.
-
What is the difference between data processing and data analysis?
- Data Processing: Involves collecting, cleaning, organising, and structuring raw data.
- Data Analysis: Involves interpreting processed data to extract insights and draw conclusions.
-
What are the steps involved in data analysis for a dissertation?
- Define research questions and objectives.
- Prepare and organise data (cleaning, formatting, coding).
- Select appropriate analytical methods.
- Use relevant software and tools.
- Conduct analysis using chosen techniques.
- Interpret findings and connect them to research questions.
- Validate and ensure the trustworthiness of findings.
- Present results using tables, graphs, and charts.
- Conclude and make recommendations.
-
What tools are commonly used for data analysis in dissertations?
- Quantitative Analysis: SPSS, R, Python, Excel.
- Qualitative Analysis: NVivo, ATLAS.ti, MAXQDA.
- Mixed Methods: Dedoose, Excel.
-
How do you ensure data validity and reliability in dissertation analysis?
- For quantitative data: Apply statistical tests for reliability (e.g., Cronbach’s alpha) and validity.
- For qualitative data: Use triangulation, member checking, and detailed documentation.
- For mixed methods: Integrate both datasets systematically to ensure comprehensive analysis.


 Evan John